He might not have been the first one to say it, but Jim Valvano, the late basketball coach at N.C. State, had a line that perfectly explained the use of statistics.
“Some people use stats like a drunk uses a light pole – for support instead of illumination.”
Whether or not he coined the phrase, it’s so very true. The use of statistics in sports is growing rapidly, not to mention the new stat categories that seem to be created and accepted every day. The percentage of times a player does just about anything is tracked, recorded and analyzed for any number of reasons.
Which leads us to the question Valvano raised – are you using stats for support or illumination. Let’s say your basketball team loses a game. You pour over the stats to figure out what went wrong. Your observation of the game leads you to think your team shoots poorly inside the paint. The stats back you up, and you ignore the 30 turnovers, the relative health and fitness of your team, and the fact that you were severely out-rebounded at both ends of the court.
 What just happened is you used stats for support. If you want to use them for illumination, maybe you should ask yourself and your players better questions. And you should start early.
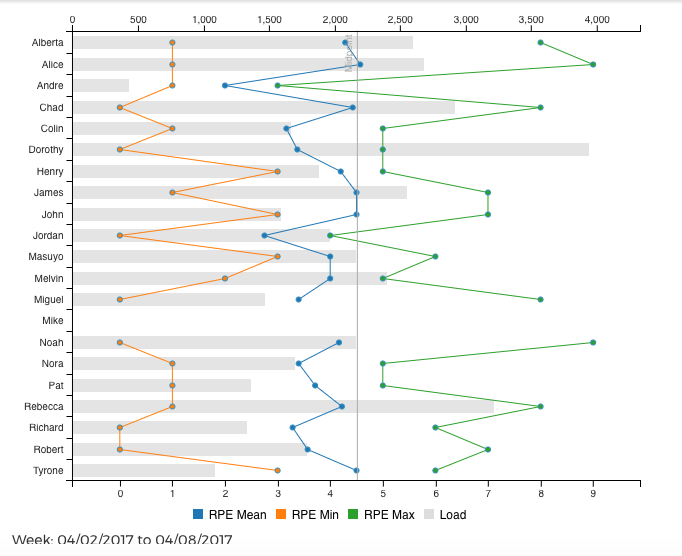
DRIVN’s trackers allow you to collect, store and chart any kind of data you designate as important. With trackers, you can get the entire picture. Not only can you track a player’s performance stats like goals, or shooting percentage, or race times, but you can see what that particular athlete did during the week, how they were feeling, what they ate, how well they slept, and what their stress level was.
All of that information can be converted into charts and graphs, and now you can look back to a time when the player or team was performing well. Then you can start asking yourself better questions about poor performances.
“Everything is measurable,” says Darcy Norman, the Director of Performance at Italian soccer club AS Roma. “You just have to decide what you want to measure, what it’s going to tell you. Sometimes you start measuring and you get information different from what you thought you’d get.
“The information collected is more valuable when you are able to compare it to other information you have collected.”
Find out how DRIVN can illuminate you.
{{cta(‘d171881a-4684-44f3-a194-7cea8dd4fe74’)}}